
ABOUT SCOTT FRANKLAND
Scott Frankland is Head of Content at Sengerio. His spirit of inquiry leads him to the world of transportation and mobility to connect with the industry’s leading experts and shine a light on the hot topics.

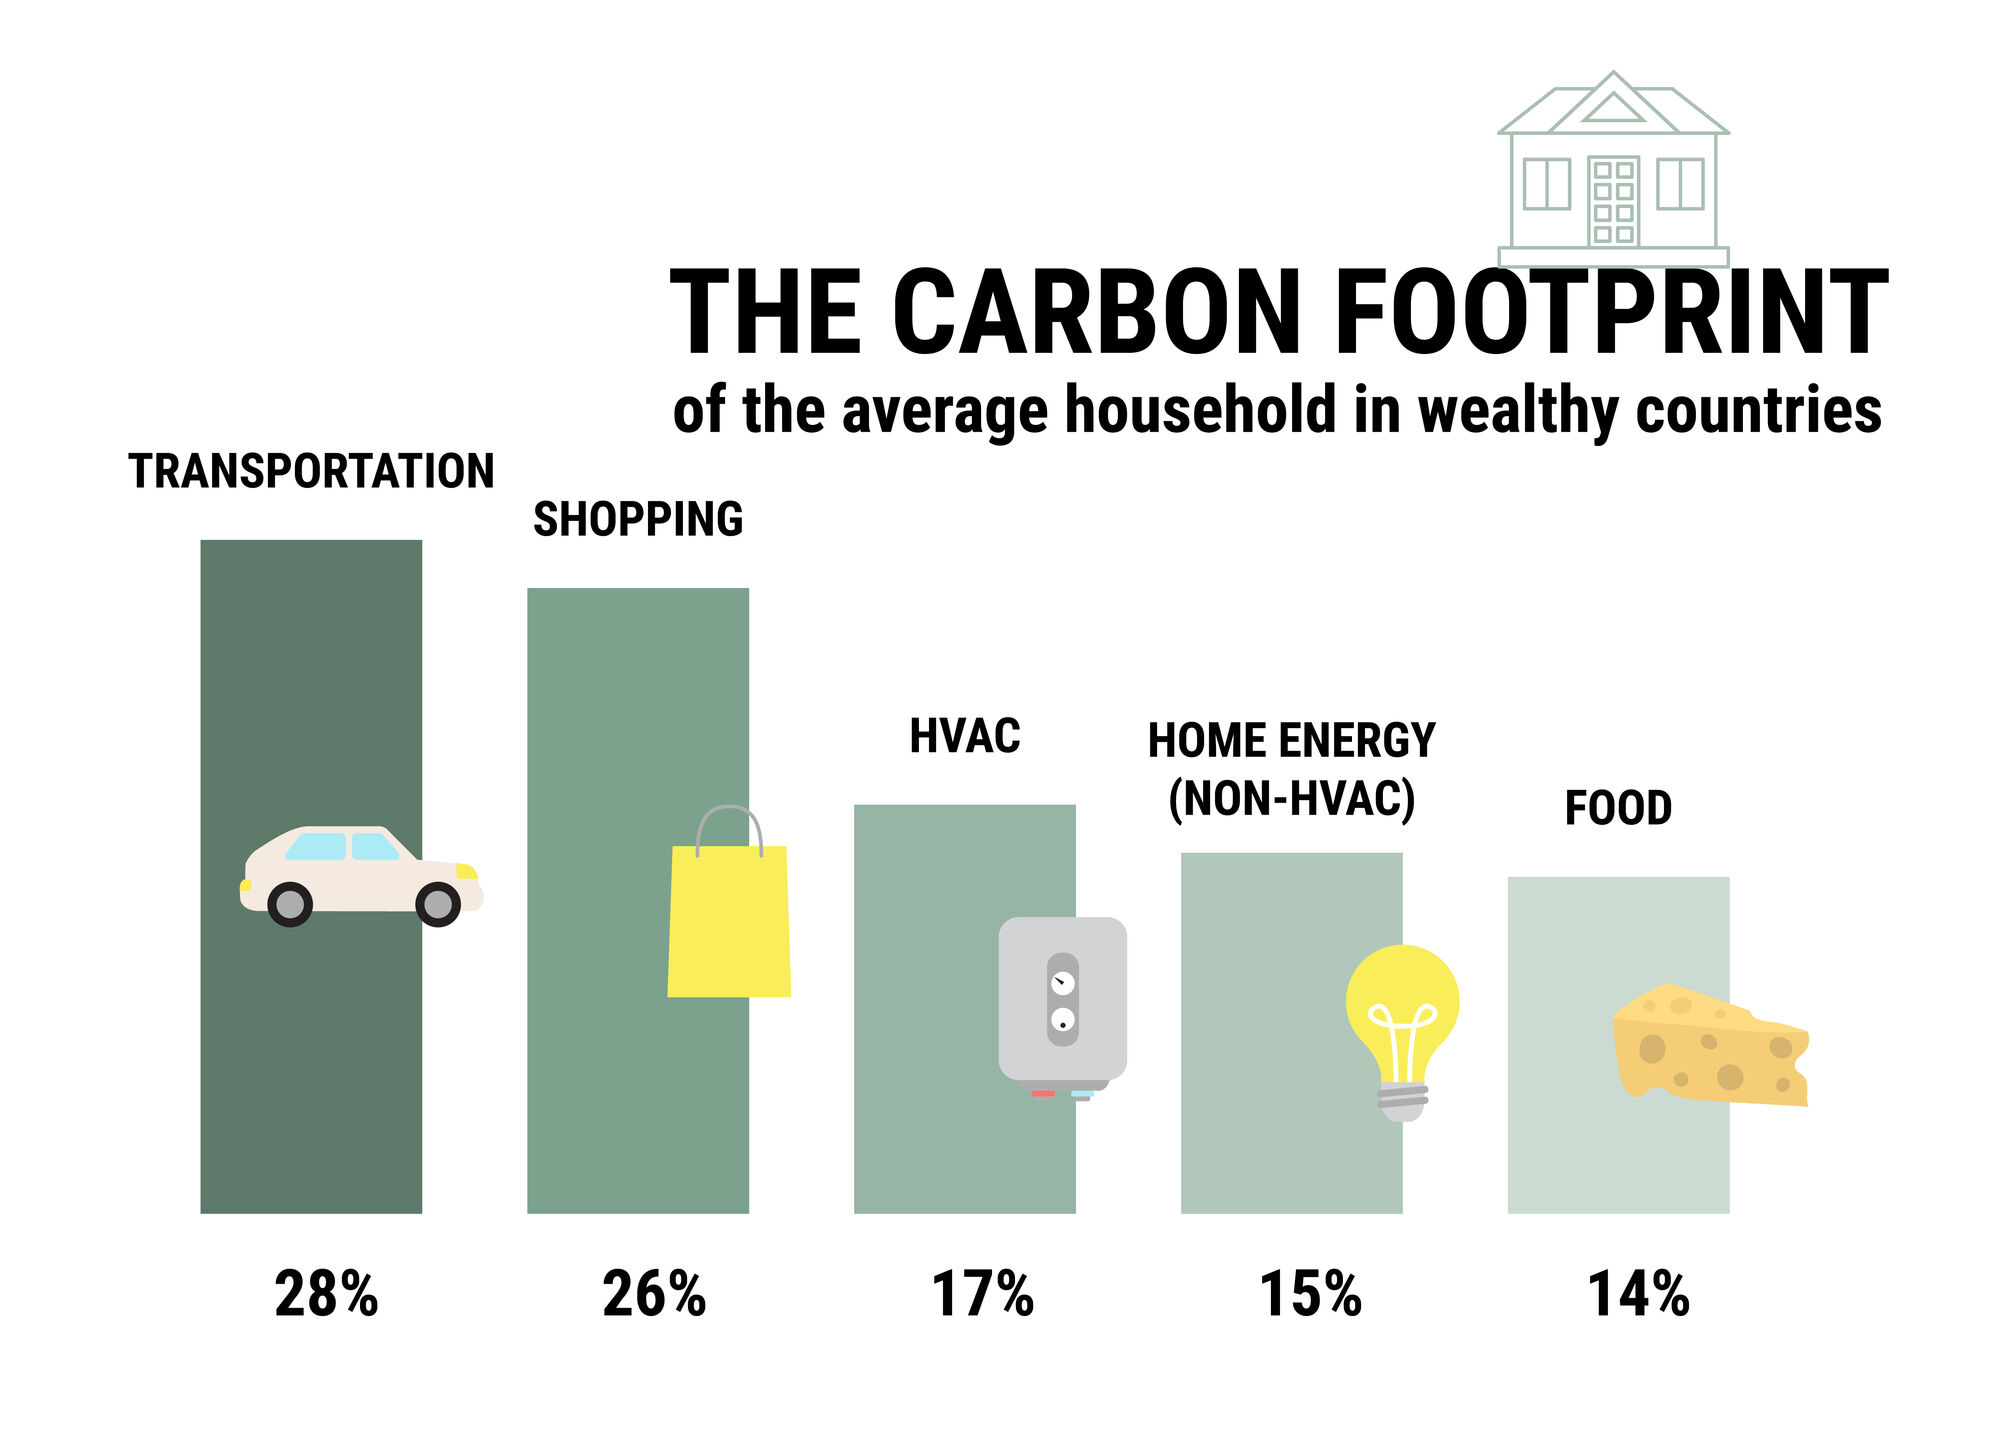
Transport accounts for around one-fifth of global carbon dioxide (CO2) emissions, with motor vehicles like buses contributing 25% of the total emissions in the U.S.
To address climate concerns, as well as an expanding population, and increasing demand for transport, experts, governments, and local authorities are pressing harder on the accelerator toward greener transportation.
The Decarbonizing Transport initiative, for instance, unites more than 70 governments, corporations, organizations, and institutions to reduce emissions in transport system activities.
Over in the bus industry, a great emphasis has been put on the need to reduce emissions and switch to more sustainable alternatives, such as electric vehicles. However, such alternatives can be a huge investment and aren’t always feasible for bus providers, so they have to find other ways to reduce their carbon footprint.
Not only do lower emissions benefit the environment, but studies have also shown that passenger satisfaction increases when more efforts are made by transport providers to find more sustainable solutions.
From tracking emissions to creating a more sustainable fleet, in this article, Sengerio provides a guide on how bus companies can move up a gear in their journey toward zero-emission transport.

Tracking emissions is a critical means of assessing a source's performance with respect to set standards, establishing baselines, creating informed policies and action plans, and gauging the progress of emission-reduction activities.
So how can transport providers understand whether they’re meeting the guidelines and operating as sustainably as possible?
It’s a question that has more than one possible answer. For instance, there are many factors a provider has to take into consideration. To name a few, these could be the size of the company, the type of services offered, and the type of fleet used to perform the services.
But without an ideal way of tracking their carbon footprint, it is difficult for transport providers to achieve their sustainability goals and reduce their carbon footprint.
So here are 3 ways in which bus providers can understand their emissions and know whether they’re on track to meet their targets.
Firstly, there is the mathematical method of understanding how much emissions a transport company is creating.
As the name suggests, it can be a somewhat complex and time-consuming process, which, due to the limitations of such calculations, only results in a rough estimate of how much carbon dioxide is being produced.

That being said, by knowing the number of miles driven and the average miles per gallon (MPG) of a fleet, it’s possible to calculate the amount of fuel burned and the number of CO2 emissions created.
Generally speaking, it’s still a handy trick to know to grasp a better idea of how sustainable a fleet is. So here’s what to do:
Step one: Calculate the amount of fuel used
The first step is to understand the amount of fuel a fleet consumes, keeping in mind whether we’re dealing with gasoline or diesel fuel.
If a bus provider isn’t sure how much fuel is used each month, they can take the number of miles the fleet has completed in one month along with the average miles per gallon.
Step two: Calculate the amount of carbon dioxide produced
According to EPA’s nifty calculations, we can roughly assume how much carbon dioxide is created by utilizing a gallon of fuel:
CO2 emissions from a gallon of diesel = 10.1kg/gallon
CO2 emissions from a gallon of gasoline = 8.8kg/gallon
From here, simply multiply the number of gallons used by 10.1 (for diesel) or 8.8 (for gasoline) to calculate how many kilograms of CO2 the fleet has emitted in a month.
Example
Let’s say a transport provider has a fleet of 50 diesel-fueled buses. Each month, one bus completes 1500 miles at an average MPG of 10. This means that each bus uses 150 gallons of fuel each month (1500/10).
Then we multiply the 150 gallons by 10.1, meaning that in total one vehicle produces 1515kg of CO2. Multiply this number by the total number of buses in the fleet and the entire emission count is 75,750kg of CO2.
Note: Remember that these calculations only provide a rough estimate of the total emissions. There are many other factors that affect emissions such as the age and state of the vehicle, and driving style (more on this later!).
From paper and pen over the internet, transport providers can find a whole range of different solutions to have a rough idea of their carbon footprint, and of the transportation sector as a whole.
There are many calculators where both individuals and bus providers can insert their trip information to receive a basic report of the emissions produced. Keeping in mind, of course, that these methods still produce a general estimate.
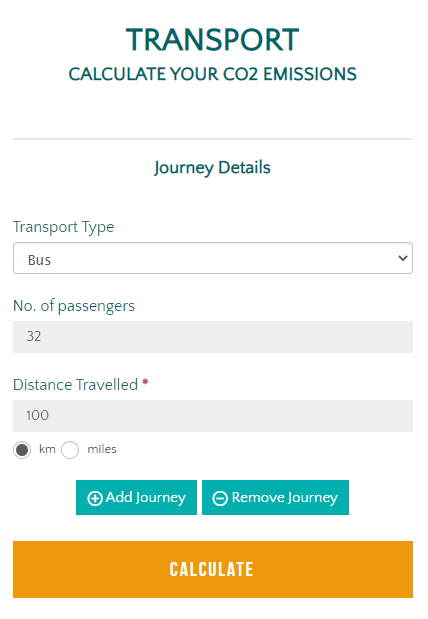
A good example of this is the carbon calculator by the World Land Trust, where users can specify which aspect of their carbon footprint they’d like to inspect; transportation, in this case.
By choosing the transport type, the number of passengers, and the distance traveled, users can have a general insight as to how much CO2 was produced from that specific journey — there’s also the option to add more trips if a user would like to calculate the emissions of more than one vehicle!
As well as the online calculators, the use of satellite imaging and AI-powered technology has enabled us to detect CO2 as soon as it is released into the atmosphere, making real-time tracking and simultaneous publication possible.
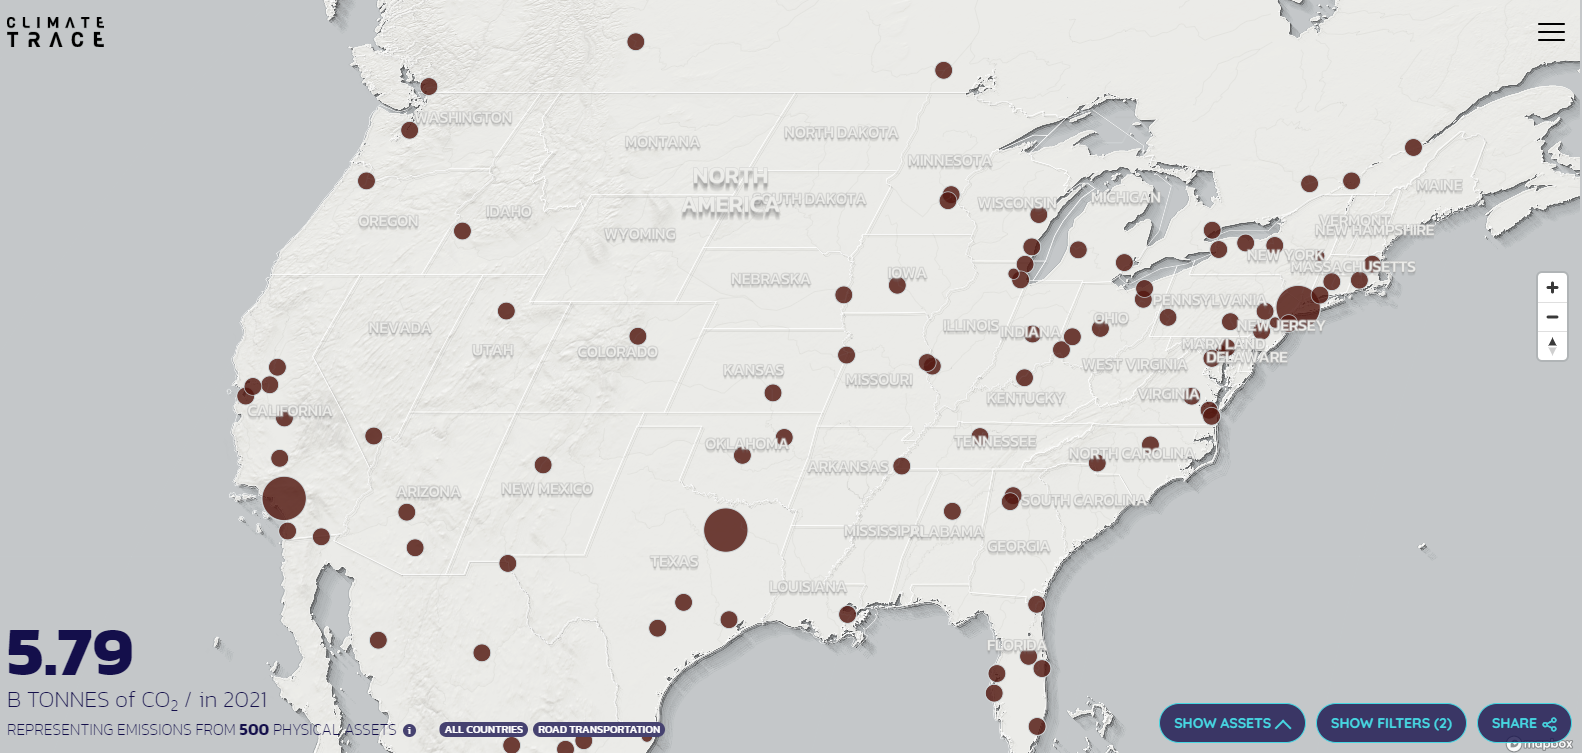
Initiatives like Climate Trace provide an overview of global emissions so users can understand how many emissions are being produced in their area.
Climate Trace has an interesting filter system where users can select to view sector-specific emissions.
For example, we can select the filter to view only the emissions associated with transportation. Then we can add a further filter to view the emissions of road transportation.
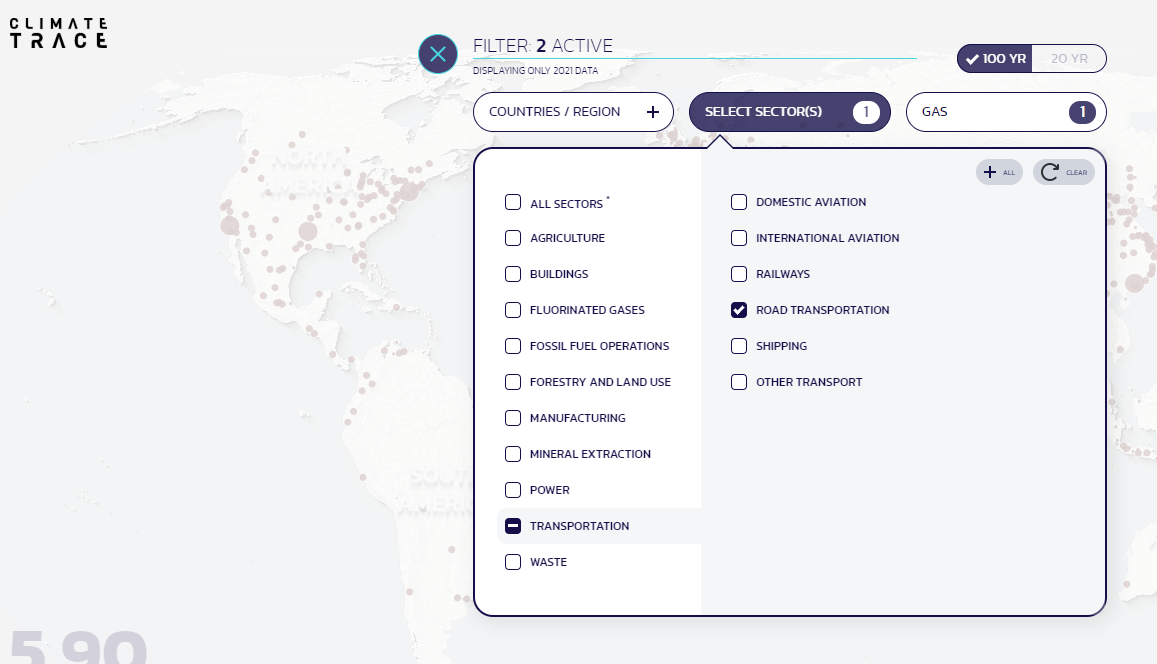
The results give a global representation of emission levels or users can zoom in on continents, nations, states, and even cities.
But while the first two points can provide a simple idea of fleet emissions, the third and final solution adds precision to the equation — rendering a more efficient way to measure a fleet's carbon footprint.
To get a more accurate measurement of a fleet's carbon footprint, there are several digital options on the market to help providers track their emissions.
These can range from decarbonization platforms, like SINAI Technologies, that can track emissions related to transportation more accurately and efficiently, enabling more intelligent carbon emission measurement and building capital-efficient strategies for the achievement of carbon-reduction targets.
As well as decarbonization platforms, there are different types of transport software that have integrated capacity to track vehicle emissions.
Typically these utilize a telematics system that collects real-time data from vehicles and feeds this information back to the base, where it is possible to view the relevant data via a user-friendly dashboard and generate reports on a fleet’s sustainability score.
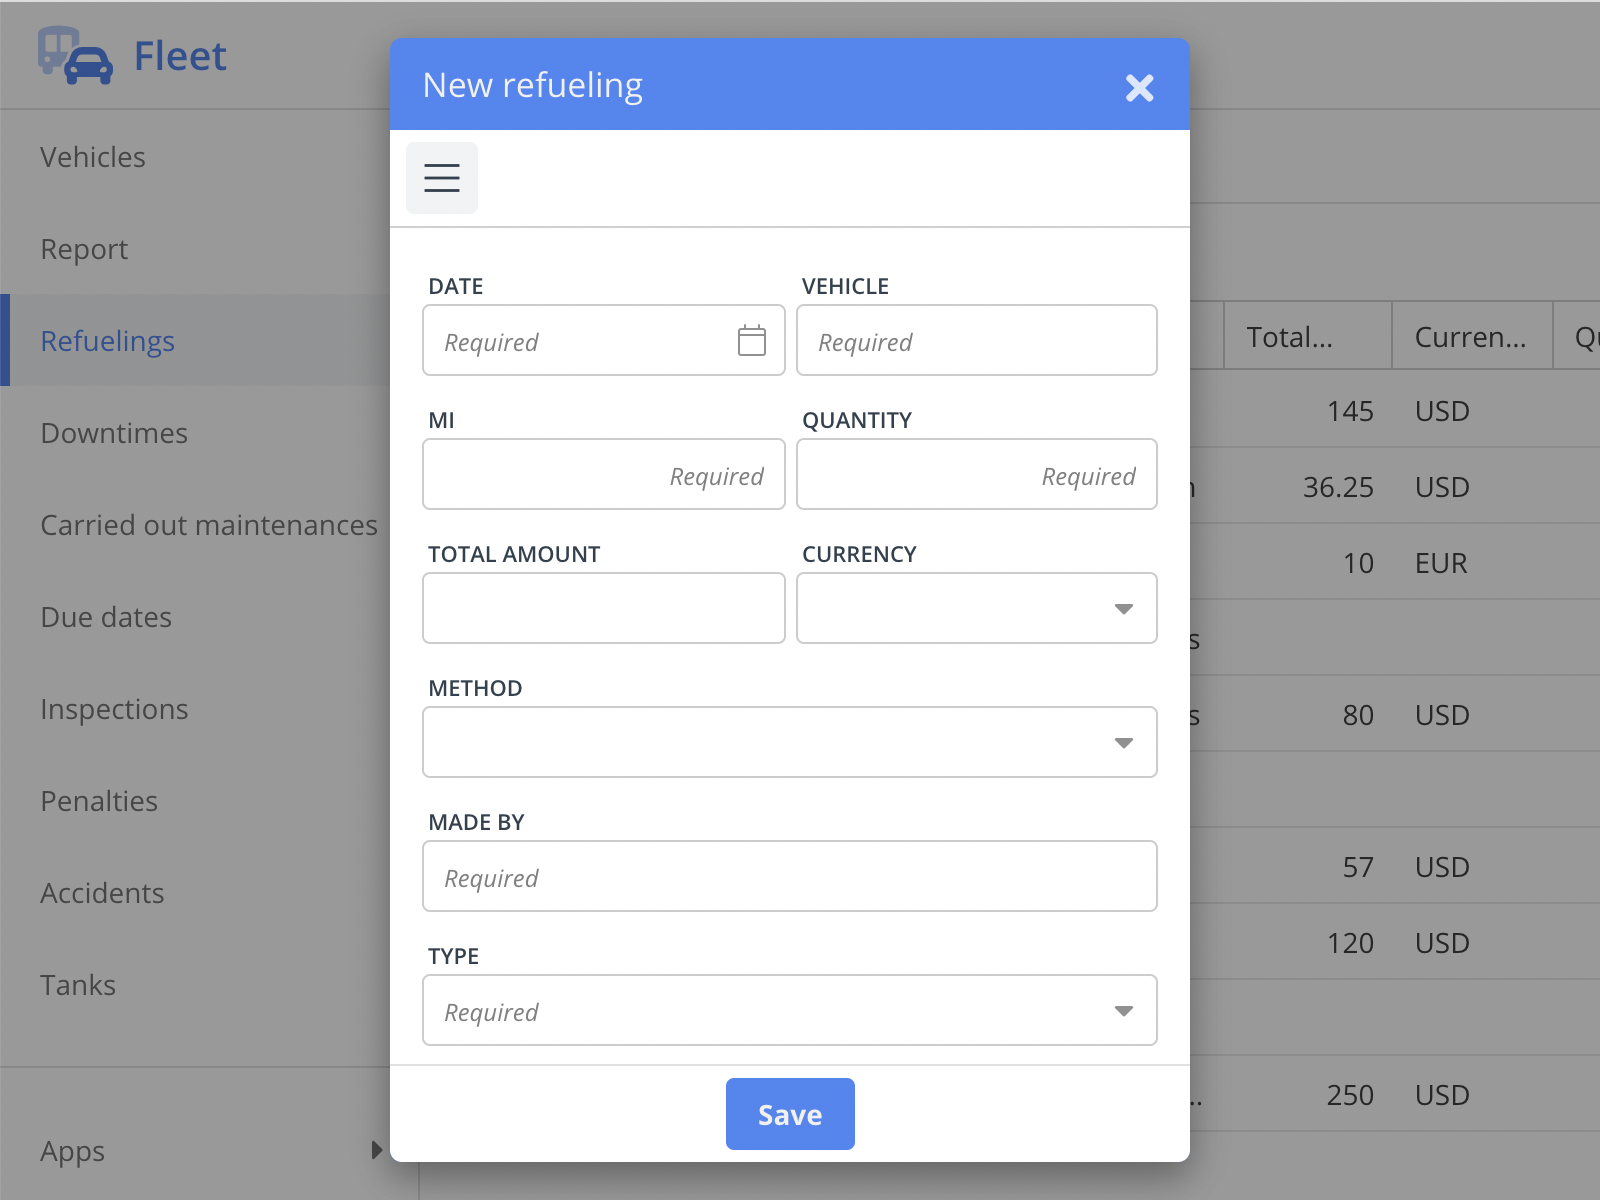
If telematics-based software isn’t a viable option, Sengerio digitalizes how fleet managers record the amount of fuel consumed for each vehicle — similar to the first two methods of tracking emissions but with a digital edge. The practicality of this is the software’s ability to coordinate a vast array of passenger transport management, including fleet management and scheduling.
That is, Sengerio provides a way for transport providers to have all the information about their fleet, scheduling, and resources in one place. This includes specific vehicle information, such as distance traveled and fuel consumption.
Digitalizing emission tracking and fleet management, in general, is a great way to identify areas for improvement, reduce a company’s carbon footprint, cut costs, and increase the efficiency and profitability of your fleet.
From emission tracking, now we’ll look at how bus providers can actively reduce their carbon footprint.
While switching to electric vehicles isn’t always an available option, there are ways in which bus providers can minimize the emissions produced by optimizing their fleets and operations.
As previously mentioned, given that the number of emissions produced correlates with the amount of fuel consumed, providers can actively render their fuel consumption more efficient to ultimately lower the emission count.
One way of doing this is keeping on top of vehicle maintenance, especially when dealing with older vehicles that might be more prone to a loose screw or two. The use of fleet management software can be highly beneficial to allow providers to stay on top of the due dates and services.
On a simpler note, but not to be overlooked, tires play a key role in fuel efficiency. Depending on the size of the fleet, proper inflation whilst out on the roads can save a huge number of fuel expenses — and emission production as a result!
From a sustainability perspective, the one thing providers don’t want is a large empty bus running down an empty street. Hence, as well as vehicle maintenance, transport companies can also reduce their emissions by optimizing their service routes and rightsizing their vehicles.
Check out this interesting article by Remix that explains what route optimization is and how transport providers can go about using their data to ensure their buses are running the most efficient services.
Just because the fleet is in tip-top shape doesn’t mean a transport provider is completely optimized, sustainably speaking.
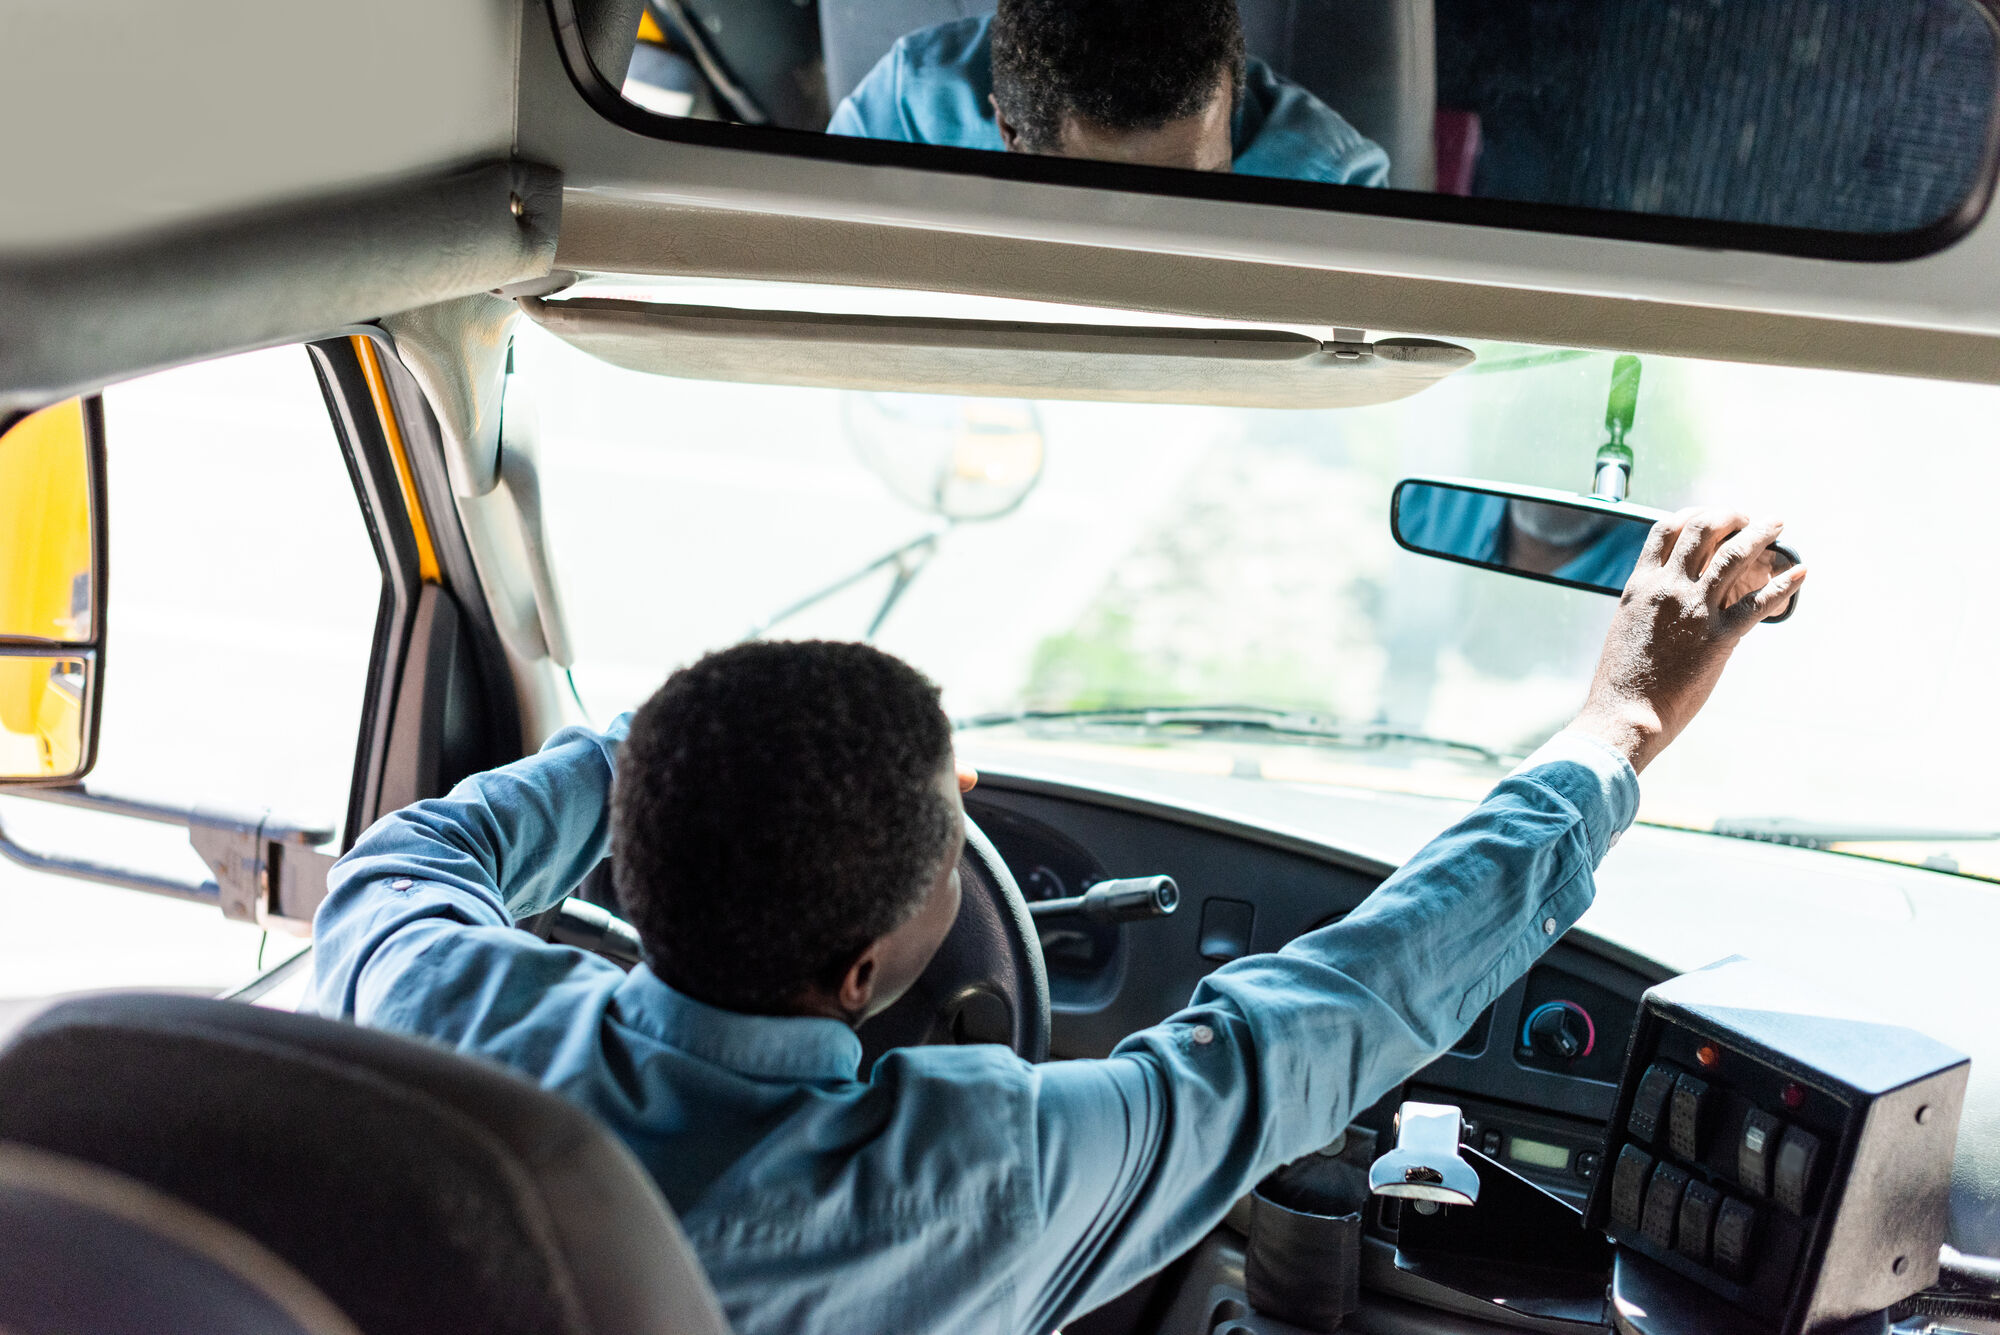
Studies have shown that driving style has a significant effect on fuel consumption and even the amount of emissions produced.
A heavy foot and aggressive driving are the number one cause of an inefficient driving style. Sharp accelerations and brisk braking have been shown to produce greater emissions.
The fundamental rule underlying efficient driving is the sparing use of the pedals for accelerating and braking.
It may sound like a platitude, but it’s because of the obvious nature of the concept that most drivers underestimate the importance of acting thoughtfully on vehicle motion controls for the purpose of reducing emissions.
It can never be an easy task to keep an eye on how vehicle performance is affecting the company’s carbon footprint.
That’s why opting for a telematics solution can be a great way to monitor the style of the vehicles when they’re out on the roads. With telematics, service managers receive several types of data, including trip information, driver feedback, and real-time vehicle information.
More specifically, the latter provides information such as the speed and consistency in which vehicles are moving and how sharply a vehicle might stop — the key factors that could affect the number of emissions released!
The benefits of telematics don’t end there, have a read this article to see the other advantages of integrating bus telematics.
The race to greener transportation is always going to be a marathon, rather than a sprint. However, the transport sector as a whole is showing incredible cohesion in finding the best solutions to today’s environmental challenges.
While there already exist many zero-emission solutions such as electric vehicles, these solutions aren’t always practical or feasible for many transport providers who have to find other solutions to reduce their carbon footprint.
From steps on how to measure a carbon footprint to driving style, this article has highlighted some fundamental steps to guide bus providers in reducing their emissions and optimizing their services.
It’s important to note that sustainable objectives aren’t solely the responsibility of transport managers, but the ability to make our world cleaner is found in the hands of drivers, analysts, maintenance, and the whole team behind the works of an efficient transport provider.
It is these small adjustments, such as reducing how hard we press a pedal or changing a simple route, that bring a greater knock-on effect to render local communities greener and happier.
ABOUT SCOTT FRANKLAND
Scott Frankland is Head of Content at Sengerio. His spirit of inquiry leads him to the world of transportation and mobility to connect with the industry’s leading experts and shine a light on the hot topics.

ABOUT EDOARDO ZACCARIA
Edoardo is the Sengerio Customer Success Manager and a passionate climber. His interpersonal skills and ability to build strong relationships have been invaluable in helping customers successfully get the most out of the Sengerio platform.